View results and checkpoints
Inspect metrics after training and find checkpoints you can deploy later.
Prerequisites
A finished or running experiment in a project you can access.
1. Open the project
From Experiments in the sidebar, open the project that contains your run.
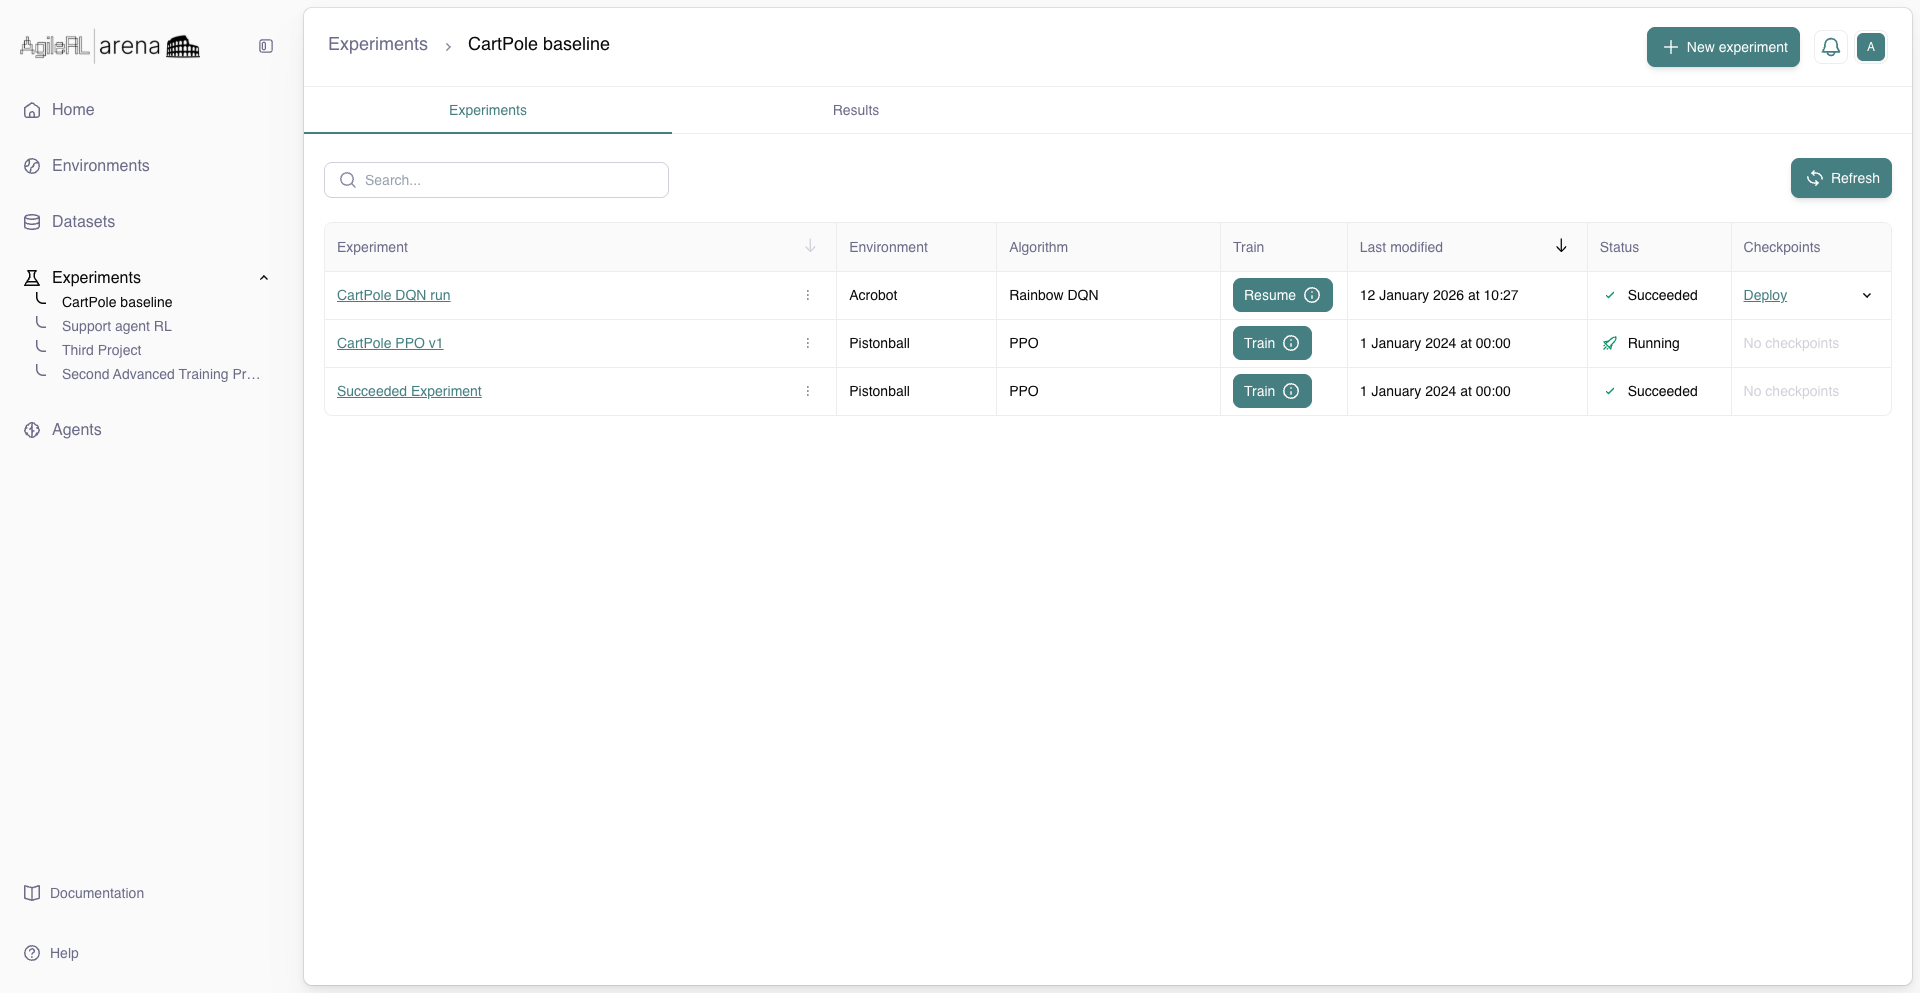
The project Experiments tab.
2. Results tab
Click the Results tab for charts and run metadata. Scroll metric charts for reward, loss, or task-specific series, and use the metric picker (if available) to inspect and compare specific chart series.
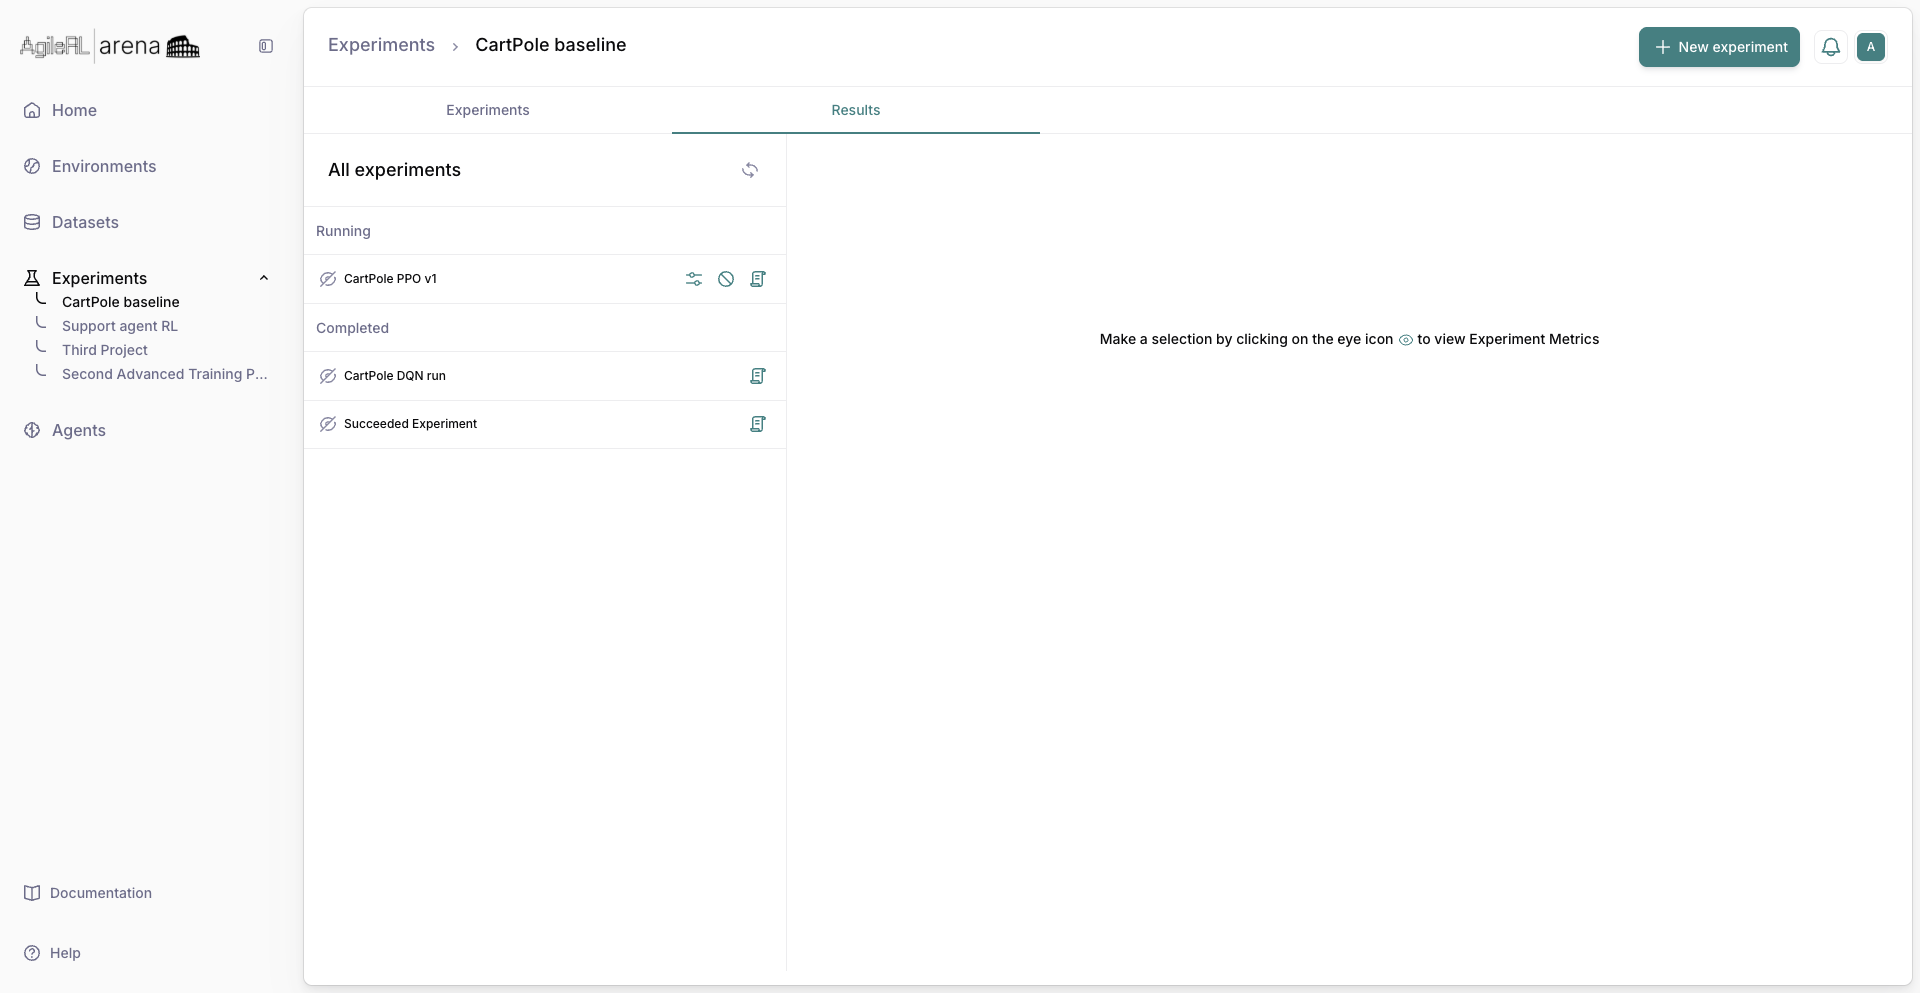
The Results tab.
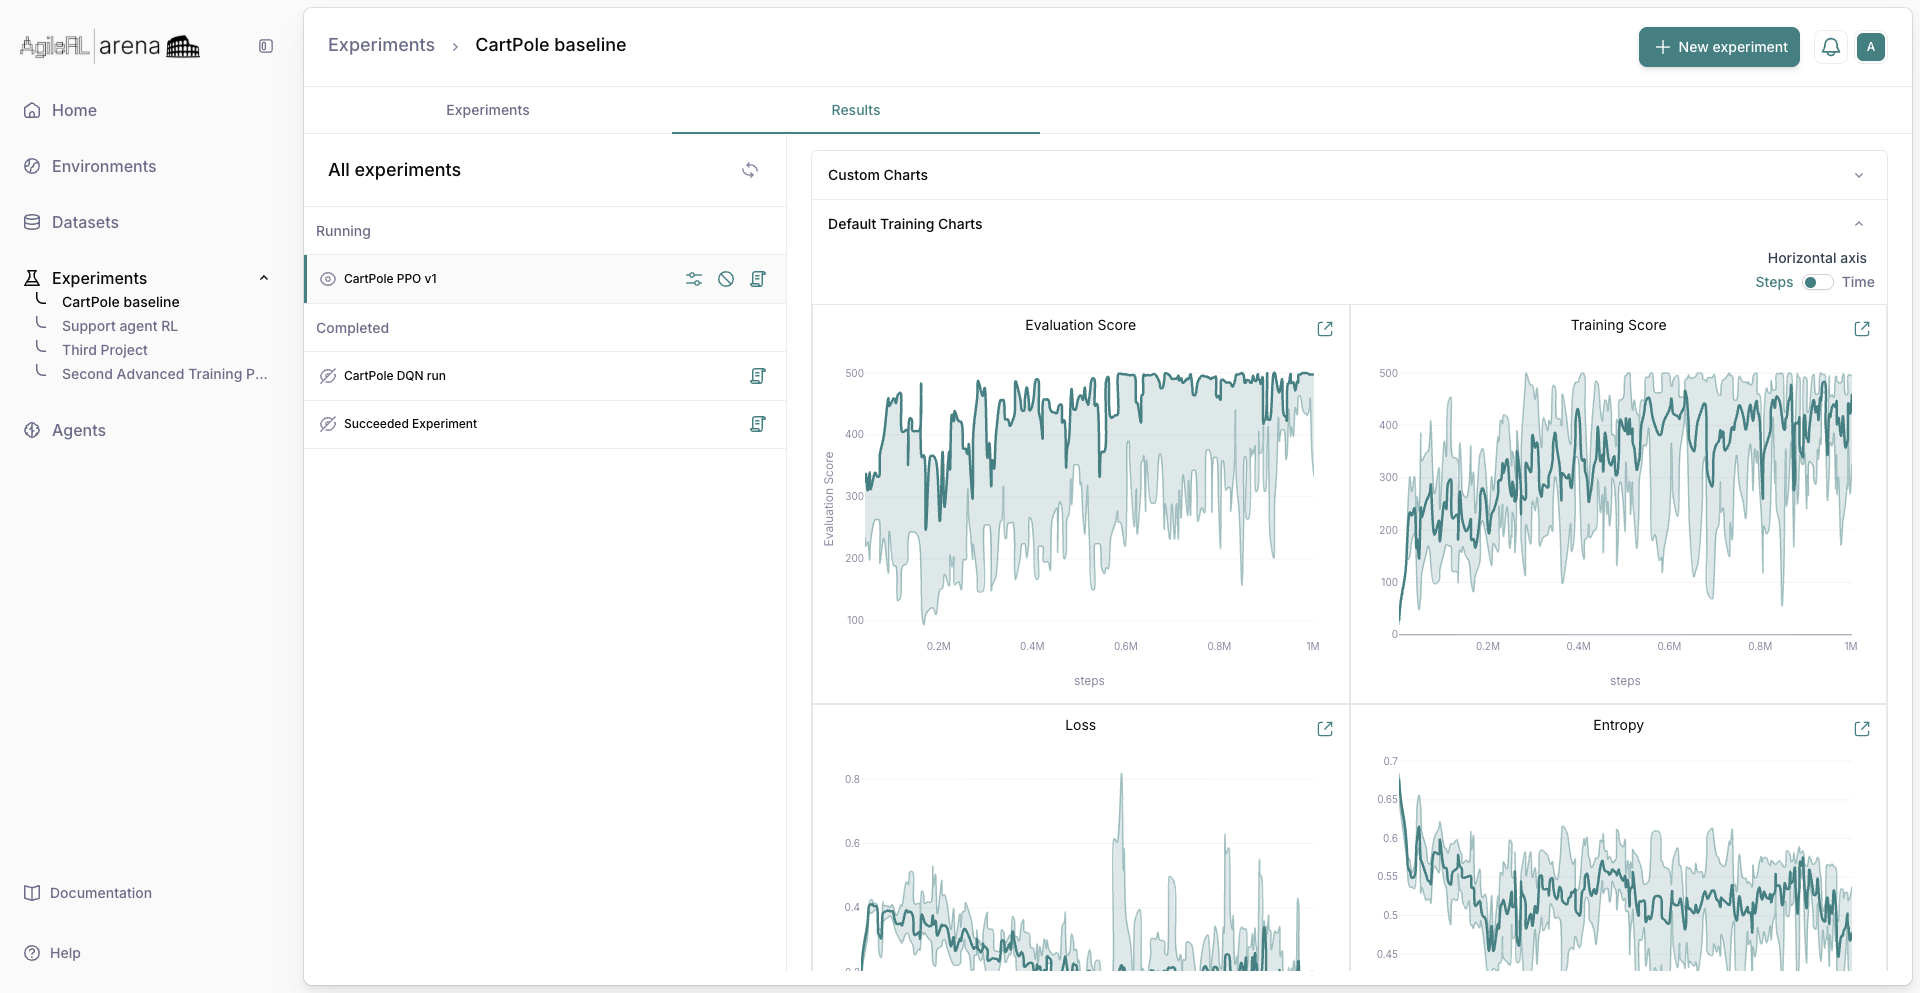
Visible selected Experiment Metrics.
3. Checkpoints
Switch back to the Experiments tab and expand the experiment row. The expanded area shows a run summary chart and a Checkpoints table listing saved steps.
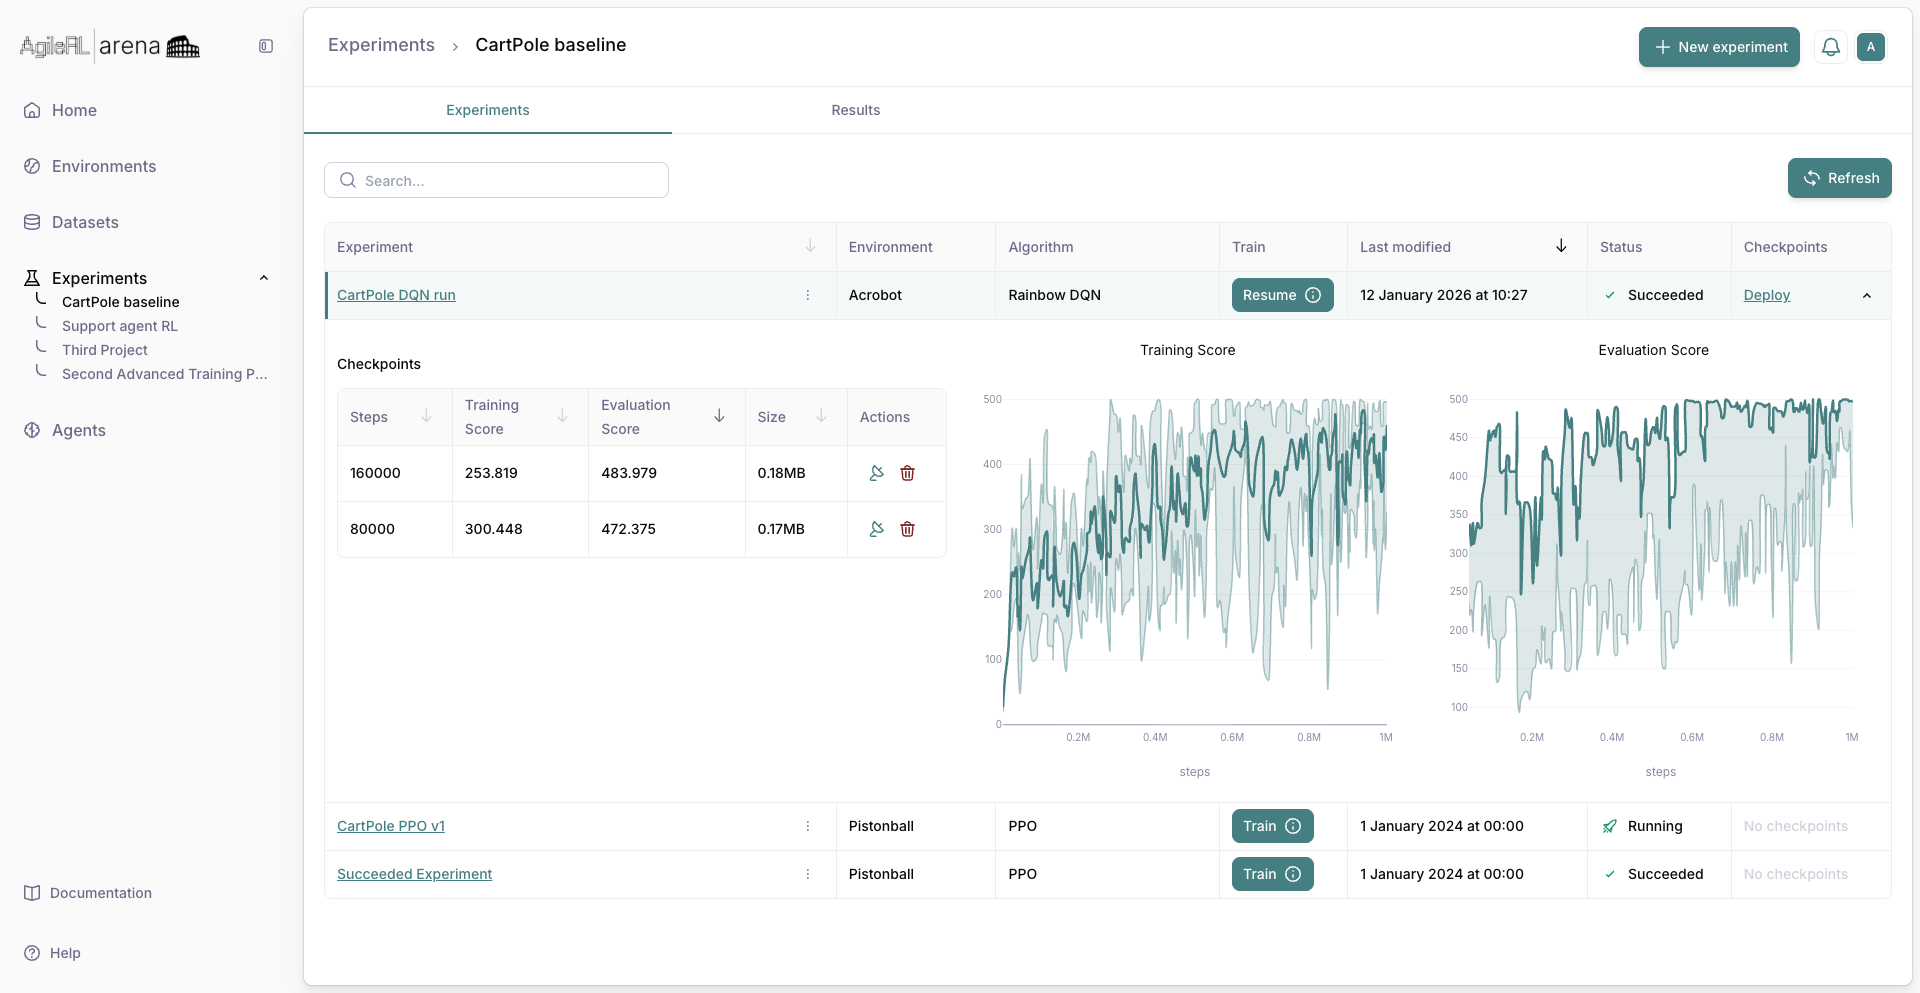
Checkpoints listed in the expanded experiment row.
4. Deploy checkpoint
In the Checkpoints table, select the checkpoint row you want to use, then click the deploy (satellite) icon (Deploy checkpoint tooltip). In the deploy modal, review checkpoint details, enter deployment fields, and confirm to deploy that selected checkpoint.
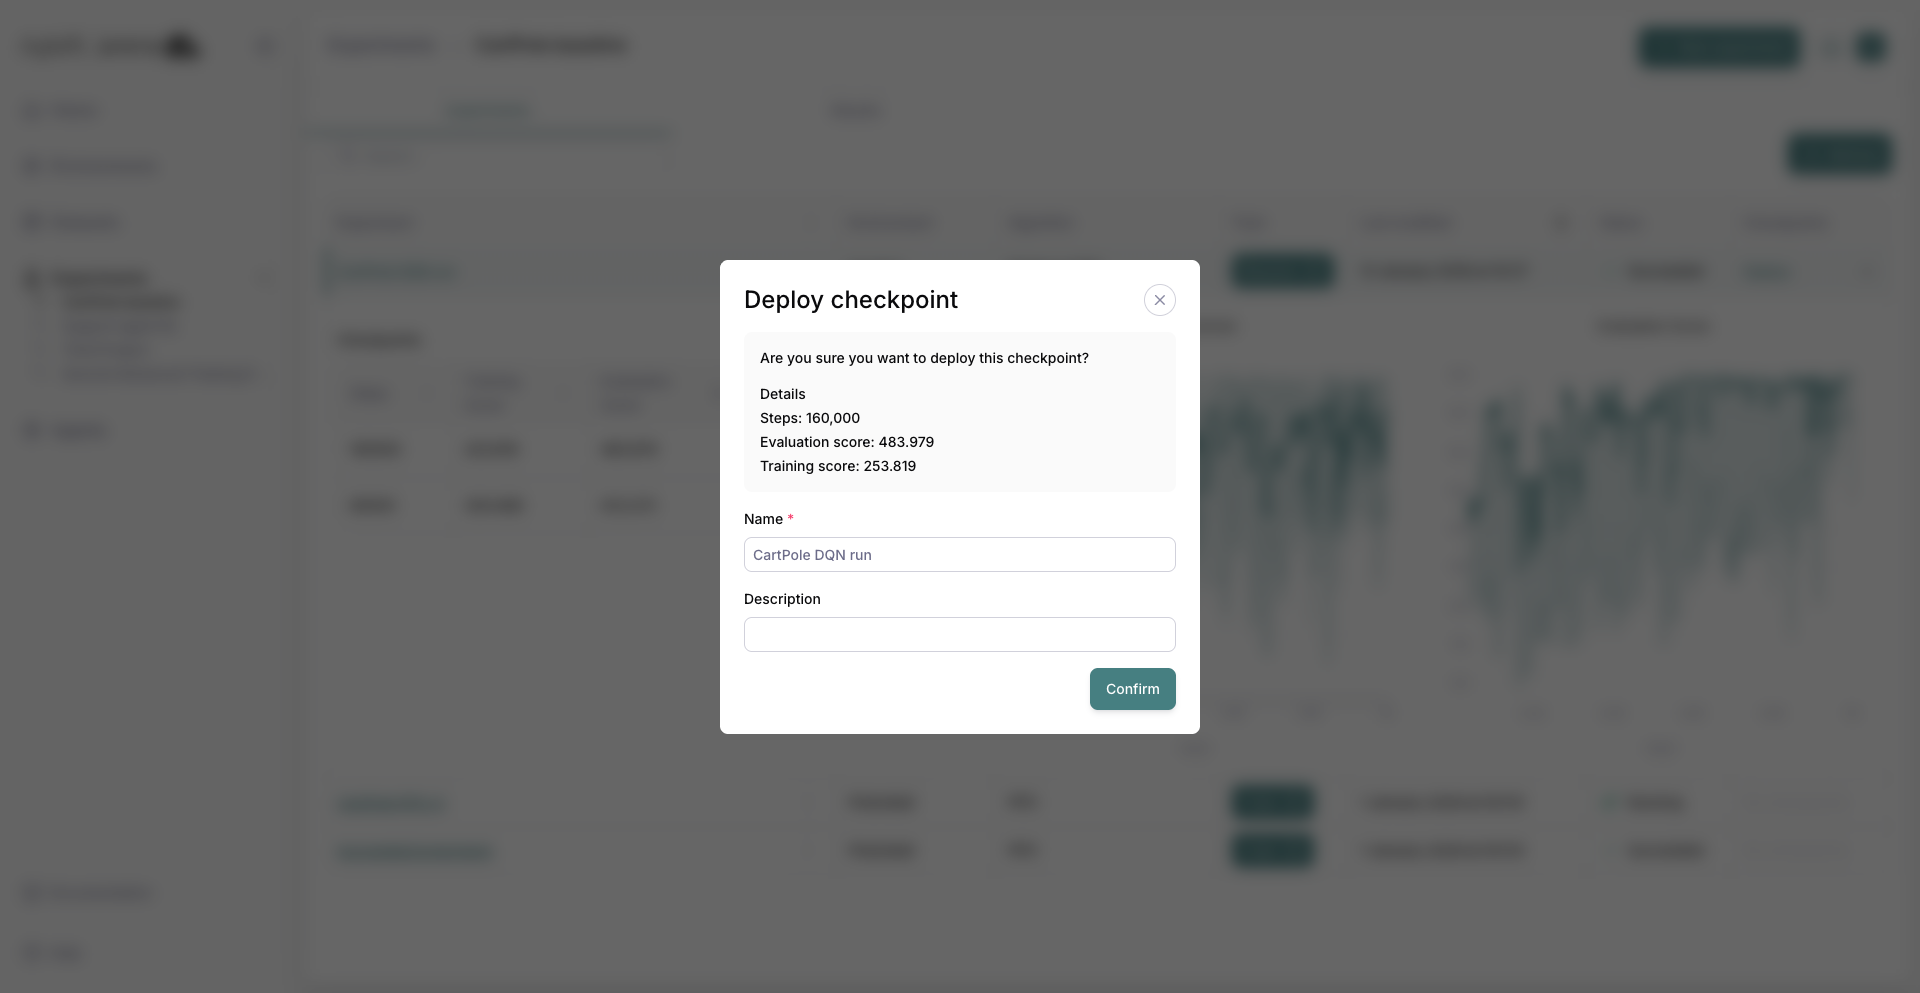
Deploy checkpoint confirmation modal.